EN SV
Start free trial

For your store

Understand your visitors from the first hour

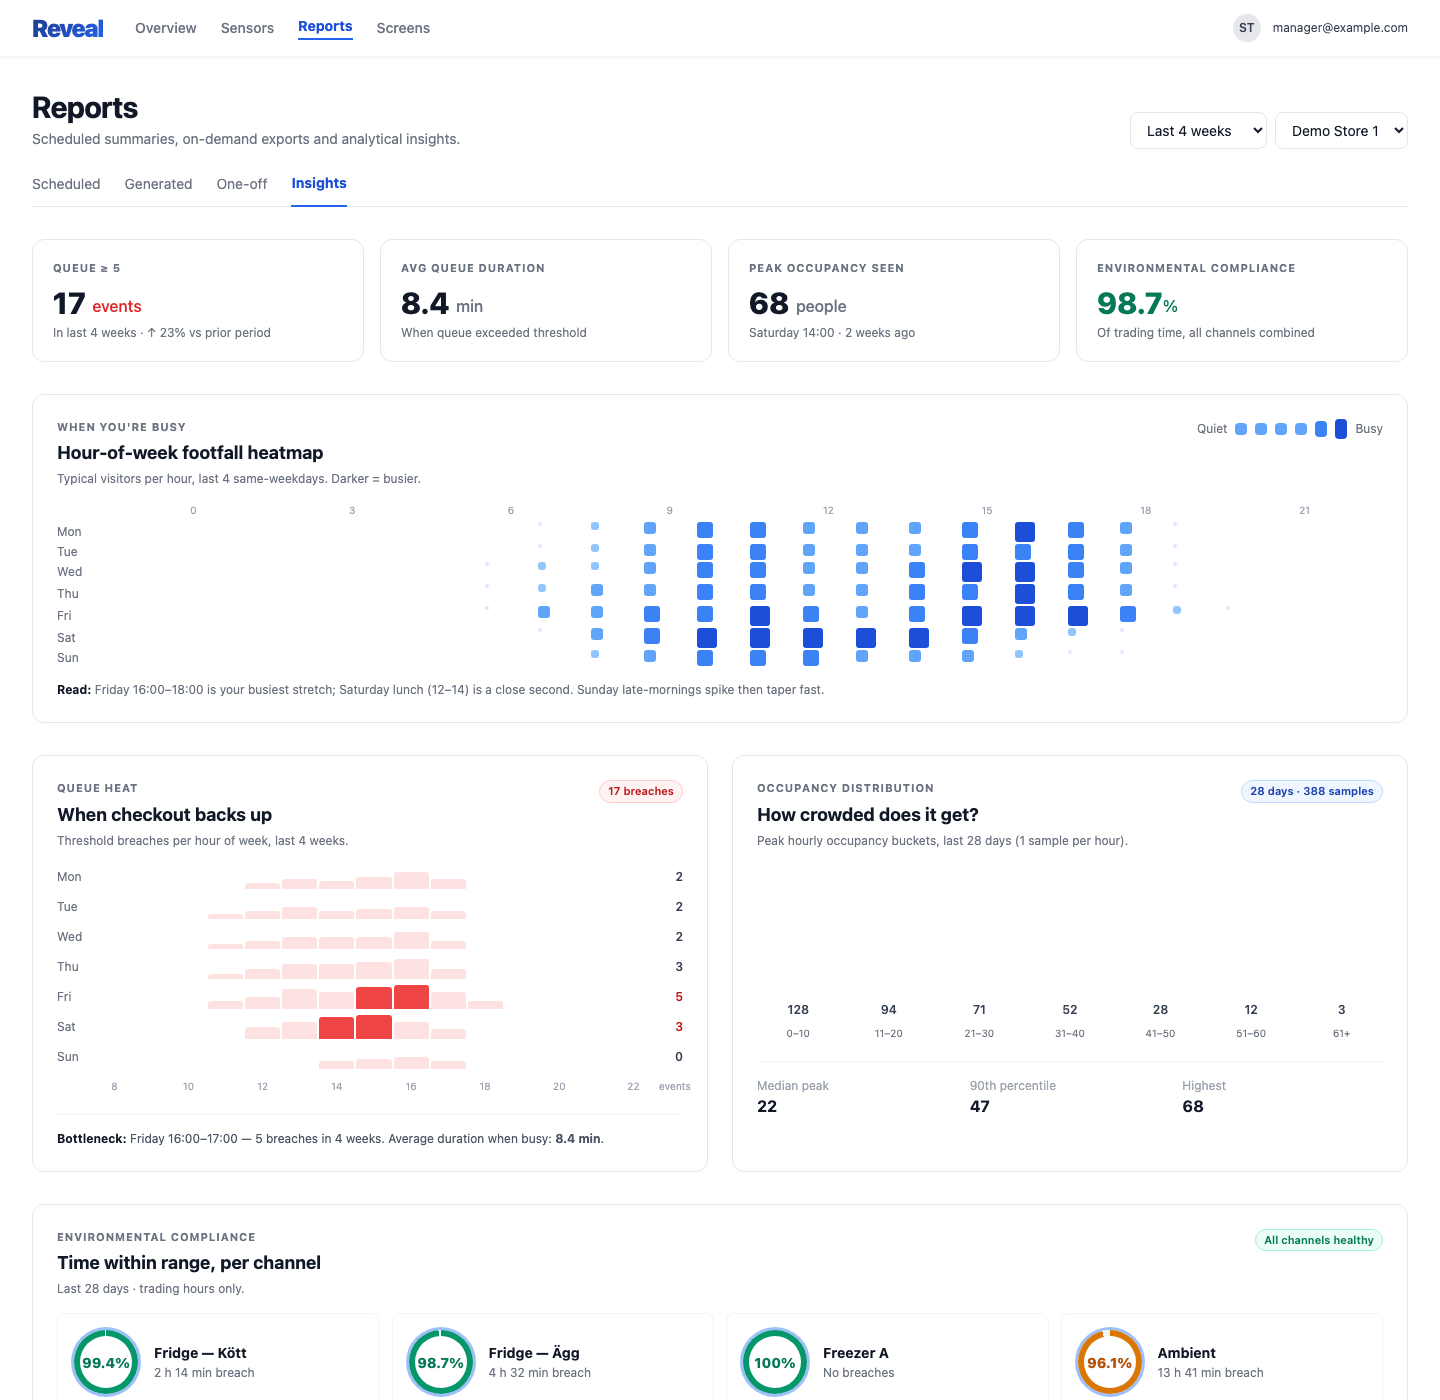
Hourly footfall live, compared to a typical week. Multi-site fleet view from a single screen. Historic data imported on connect so you start with weeks of trends — not an empty chart.

30-day free trial · no new hardware · cancel anytime

reveal.raptix.se/sites/demo-store-1
Reveal single-site overview — live visitors, typical-Friday comparison, queue alert and hourly chart

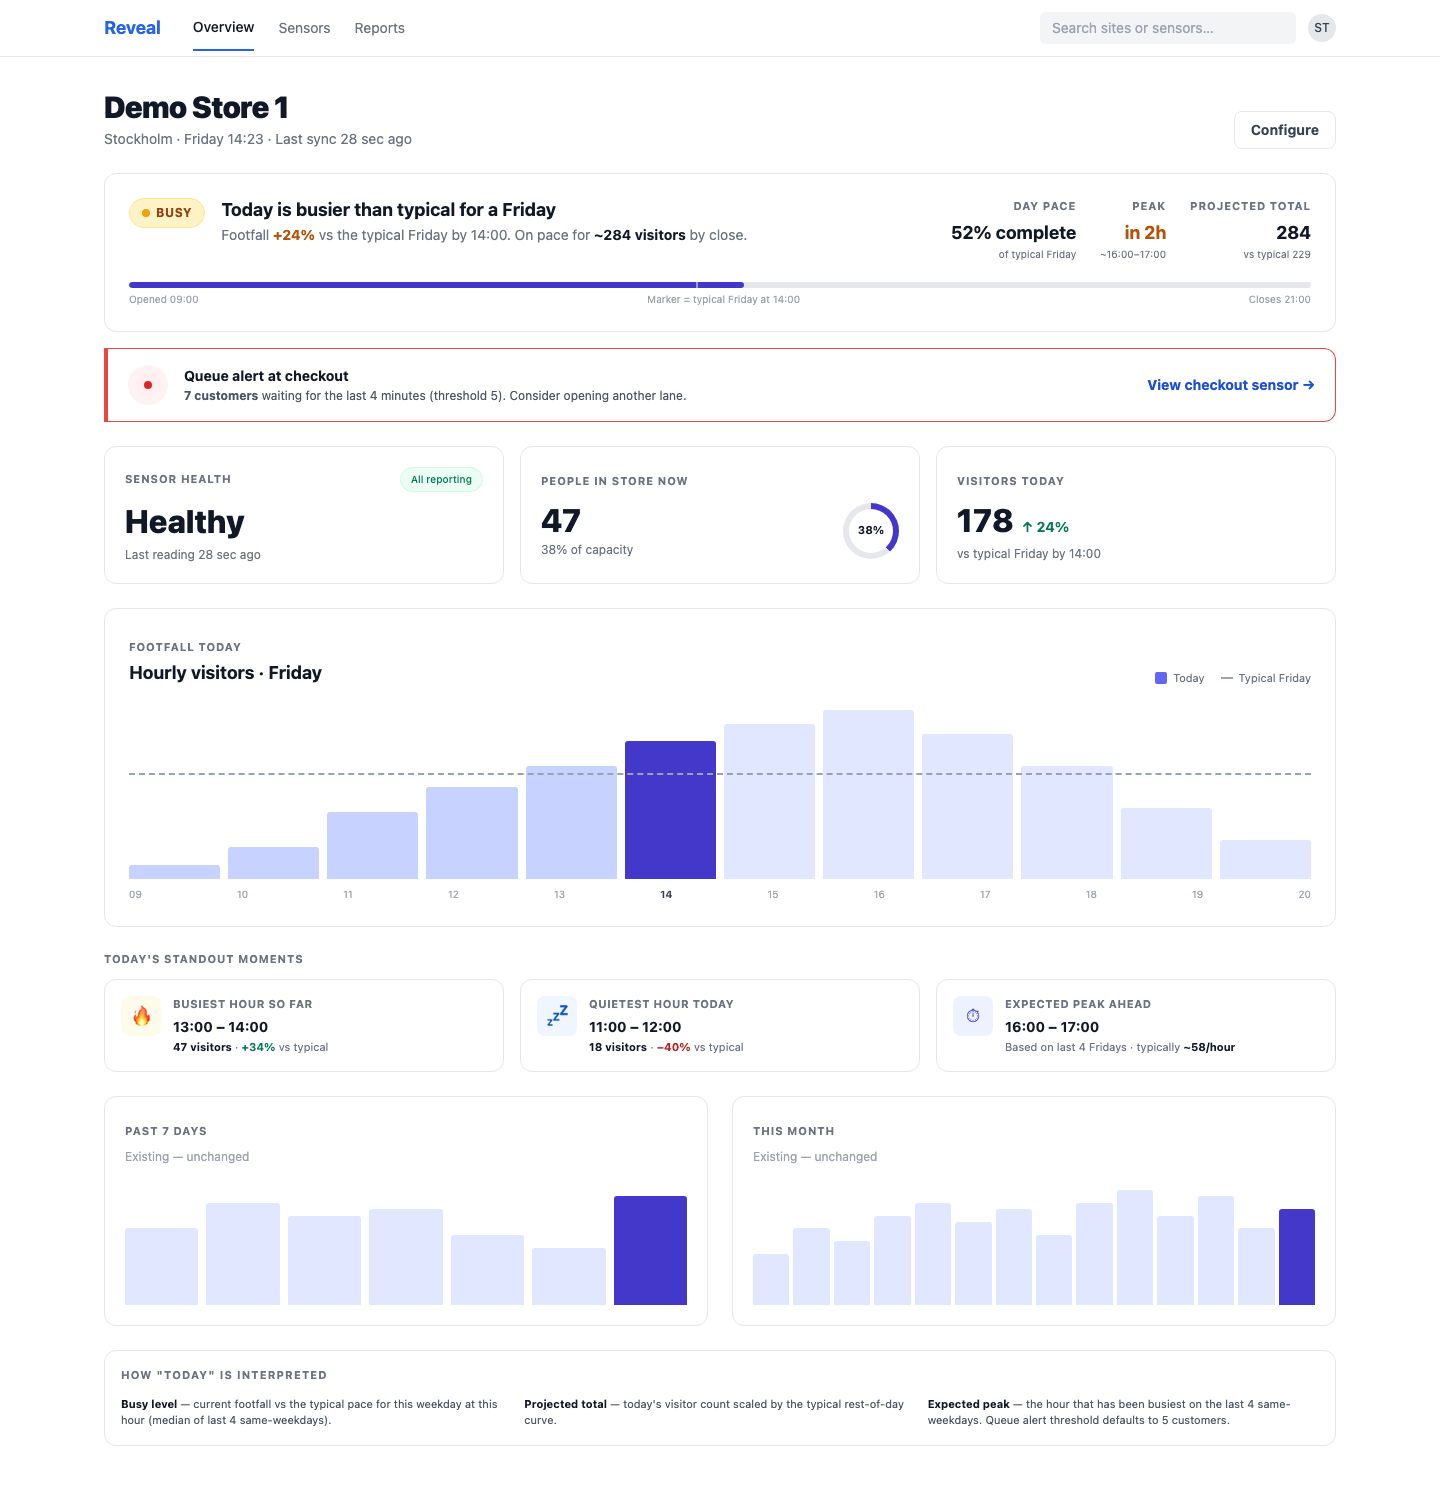
Reveal's overview — live visitors, typical-Friday comparison, queue alert and peak forecast.

Gut feel isn't enough anymore.

You know Friday is busy. But how busy compared to last Friday? Compared to the same Friday last year?

Manual counting isn't reliable. Excel exports from Avigilon are tedious. And no one really knows what "typical" means — because "typical" depends on weekday, weather, month and four other things.

Reveal counts for you, compares against a four-week median for the exact same weekday and hour, and tells you "this is unusual" or "this is normal".

Three steps

From Alta counter to insight

1

Connect your Alta account

Reveal finds all your counters — entrance, checkout, sections — and imports your historic data on the spot. No manual CSV uploads.

2

Map counters to KPIs

Point at which counter measures visitors (usually the entrance), which measures occupancy, which measures the queue. Drag-drop. Done in 2 minutes.

3

Live from day one

Hourly chart for today, comparison vs. typical Friday, peak forecasts. No need to wait three months to build a baseline — it’s already there.

Features

Everything you need to understand visitors

Real-time counting with comparison

Hourly footfall with a dashed reference line showing your typical Friday. Above? Below? Reveal tells you instantly — "Today is +24% vs. typical Friday".

Multi-site fleet view

District manager sees every store side by side with busy level, queue status, day pace and 7-day trend. One glance — and you know which store needs attention.

Hour-of-week activity heatmap

Which hours of which weekday are your busiest? Reveal shows it as a colour-coded grid — last 7, 28 or 90 days. Staff on data, not guesses.

  • · Heatmap by hour and weekday
  • · Filter by site and date range
  • · Compare against the same week last year
  • · Export as image or CSV

Historic data imported on connect

When you connect Alta, Reveal imports counter data backwards. The hour-of-week pattern works day one. You don't start from zero.

Aisle activity (per section)

If your Alta cameras count passages per aisle or section, Reveal surfaces that. Which departments dominate the foot traffic? Where do people linger?

Trading-hours aware

Reveal knows when you're open. Metrics show only during trading hours — no noise from overnight cleaning or deliveries.

The Insights tab

The patterns behind the numbers

Hour-of-week heatmap, queue analysis, occupancy distribution and environmental monitoring — all in one tab.

Reveal's Insights view — hour-of-week heatmap, queue analysis, occupancy distribution, environmental monitoring

FAQ

Common questions

Which cameras do I need? +

Any Avigilon Alta camera with people-counting or line-crossing analytics enabled. Usually this is already on for entrance cameras. Reveal discovers them automatically.

How accurate is the counting? +

It depends on the Alta camera's accuracy, angle and lighting. For a standard entrance install, accuracy is typically 95–98%. Reveal doesn't count itself — it reads the values Alta already calculates.

How far back does the data go? +

As far back as your Avigilon Alta account keeps it. On first connect, Reveal imports everything — could be weeks, months, sometimes years depending on your Alta configuration.

Do staff and deliveries get counted too? +

Technically yes — Alta counters don't distinguish. You can filter out time outside trading hours, and you can mark certain counters as "staff entrance" so the main numbers don't mix them in.

Can I compare across sites? +

Yes, the multi-site view places stores side by side with the same KPIs. You see immediately which are busier or quieter than normal — without comparing manually.

What is "typical" based on? +

Reveal computes typical as the median of the same weekday and hour across the last four weeks. It's robust against one-off outliers (bank holiday, fire alarm, etc.) and updates automatically.

Explore more

See your real visitor patterns today

Connect Alta, point at your entrance counter, open the overview. Weeks of trend, seconds to set up.

Start free trial